How fast a company learns, and what that learning is worth.
AI is a commodity input. The model is no longer the moat. The moat is the rate at which a company compounds intelligence from its own data. The Intelligence Yield Curve measures that rate and connects it directly to enterprise value.
The market is pricing the label, not the substance.
AI startups captured 50 to 61% of global venture capital in 2025. Fewer than 1% of companies have actually reached advanced AI maturity by structured assessment.
That spread is a systematic mispricing on a multi-trillion-dollar scale. IMX invests where context, integration and continual learning drive outperformance, and prices it with the curve.
Sources: OECD, Crunchbase, PitchBook; ServiceNow Enterprise AI Maturity Index 2025.
A single coefficient, a direct line to enterprise value.
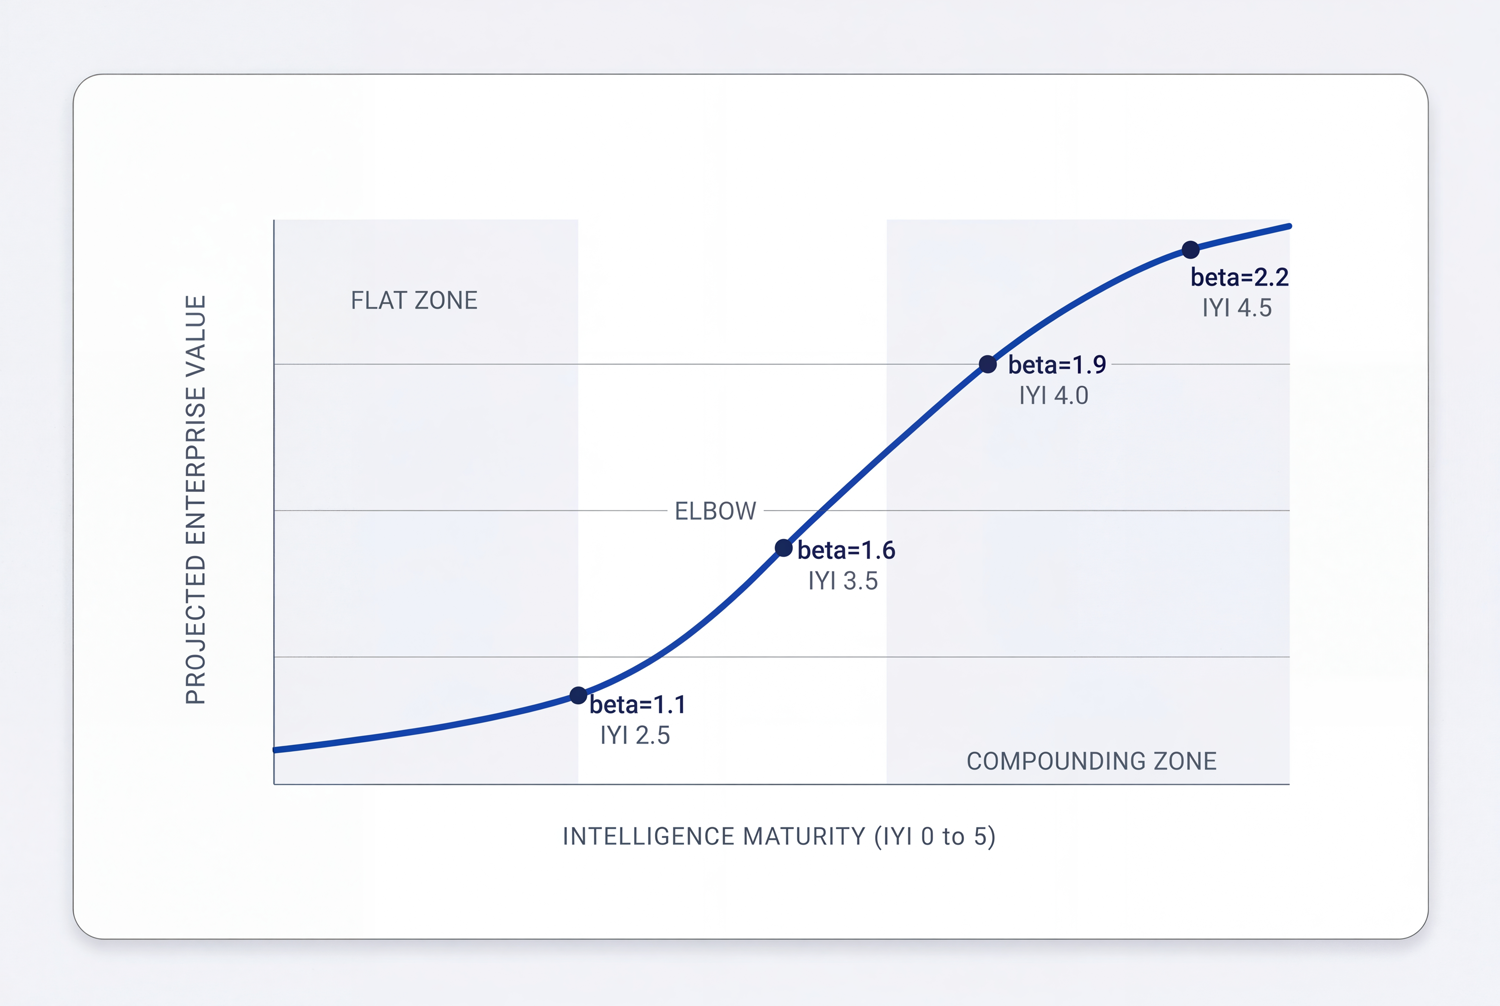
The IYC produces one coefficient, beta, the Intelligence Yield Coefficient™, describing the steepness of a company's learning curve. Beta maps directly to implied EV/Revenue multiples and to forward compounding projections.
Companies sit on a curve from a flat zone, through an elbow, into the compounding zone, scored by the Intelligence Yield Index (IYI, 0 to 5). Yield steepens as adoption increases, fuelled by exclusive data from deep integration.
Intelligence maturity, scored 0 to 5 on each.
Data Depth
How much proprietary data the company captures through normal operations, and how structured and accessible it is.
Intelligence Reinforcement
The speed of the feedback loop from outcomes back to model improvement.
Feedback Frequency
How often the system receives and processes outcome data: real-time, batch, or manual.
Human-AI Integration
How effectively people and AI co-train each other within the workflow.
Adoption Breadth
Breadth of real usage across customers, teams, use cases and partners.
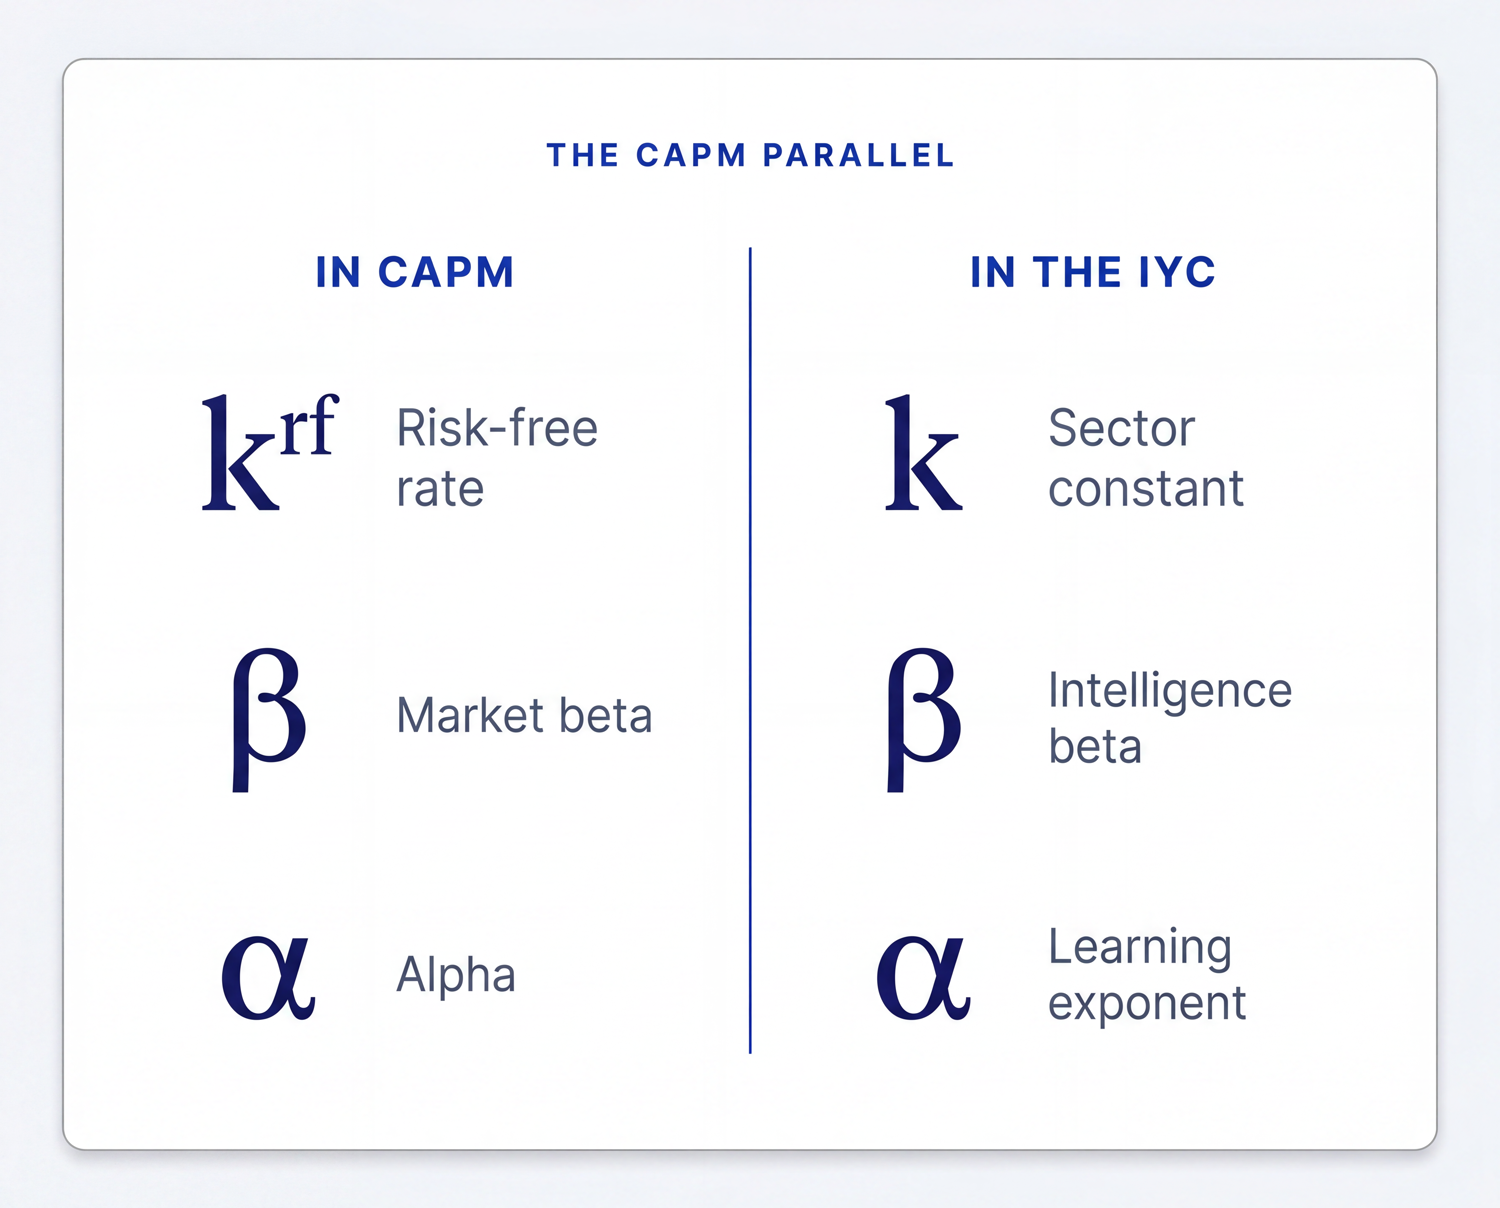
Same architecture as the Capital Asset Pricing Model. New inputs.
In CAPM, expected return decomposes into a risk-free baseline plus a risk premium scaled by market beta. In the IYC, enterprise value decomposes into a sector baseline plus an intelligence premium scaled by intelligence beta.
When a fund manager asks what a company's beta is, the IYC reframes the question from how volatile the stock is to how fast the company learns.
Same revenue. Different intelligence. A 4.5x valuation gap.
| Company A | Company B | |
| Revenue | USD 50m | USD 50m |
| IYI Score | 1.5 | 3.6 |
| Beta | 0.59 | 1.69 |
| Implied EV/Revenue | 2.1x | 9.5x |
| Implied EV | USD 105m | USD 475m |
Illustrative figures from the published primer. The gap is the difference in intelligence compounding.
The overview, and the working paper.
The IYC overview is a 47X primer covering the framework, the dimensions and the mechanics. The full working paper is published on SSRN.
Published by Xavier J. R. Kris, CEO of IMX Funds Limited (ADGM) and founder of 47X Group, March 2026. The IYC, the Intelligence Yield Coefficient, IYI and DIFHA are proprietary to Xavier J. R. Kris, IMX Funds Limited, and 47X Group. Provided for informational purposes only. Not investment advice.
 Operating Partner · Diagnostics
The IYC diagnostics run through 47X Group.
Founders can self-serve the 15-question Quick Score for a beta range and an implied EV/Revenue band. Investors can request the full 75-question portfolio diagnostic with a 30-minute principal readout.